Bitcoin registered an intraday low of $58,189 on June 25 before clawing back toward $60,100 as of press time, even as the Federal Reserve’s preferred inflation gauge landed roughly in line with expectations.
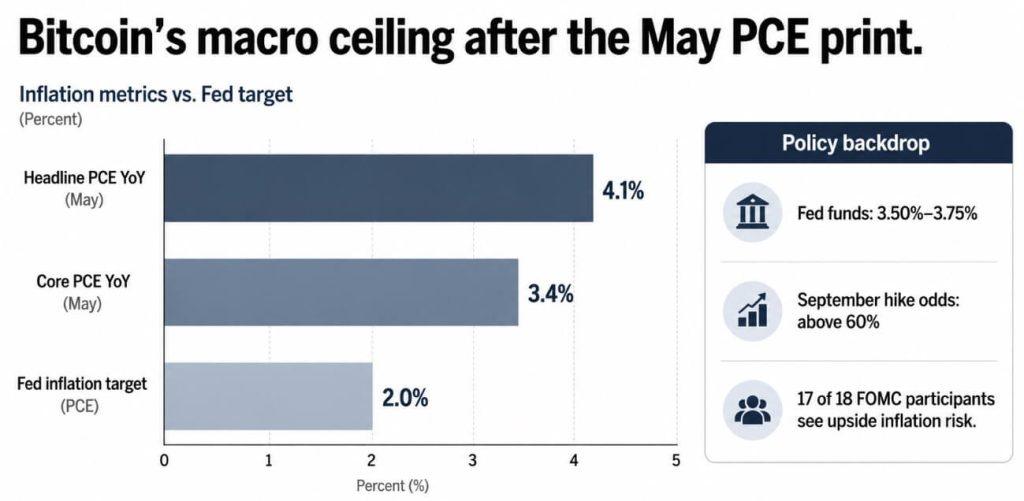
The May PCE print came in at a headline of 4.1% year over year and a core of 3.4%, with a monthly headline of 0.4% versus a 0.5% estimate. It cleared the immediate downside threat of an upside inflation shock, leaving BTC without a new bid.
Matt Mena, senior crypto research strategist at 21Shares, called the print “a brief exhale.” Headline PCE is still over double the Fed’s 2% target.
The June FOMC statement kept rates at 3.50%-3.75% and noted that 17 of 18 participants judged inflation uncertainty to be above normal, with risks weighted to the upside.
The Fed ceiling
Can-Luca Köymen, investment strategist at Sygnum Bank, described the current policy environment as a “print-by-print Fed,” where core PCE drives decisions more than CPI, and Warsh has already signaled that forward guidance is no longer a policy tool.
September hike odds stayed above 60% after the June 25 data, with market pricing pointing to a hawkish path through year-end.
When dollar strength reasserted in recent weeks, Glassnode described DXY’s move as “not constructive” for BTC and the dominant macro signal.
The June 25 modest dollar easing after PCE tracked directly with Bitcoin’s partial recovery from $58,189 toward the high-$59,000 area, underscoring how heavily Bitcoin now trades as a liquidity-sensitive risk asset.
Alex Blume, founder and CEO of Two Prime, said Bitcoin has “struggled in price and in garnering attention,” while AI stocks have captured the bulk of risk appetite.
US semiconductor stocks surged roughly 170% over the prior year, while Bitcoin shed around 40% over the same period. A hawkish Fed and AI-equity dominance leave BTC fighting for flows on two fronts simultaneously.
The $58,000 Bitcoin price stress test
Bulls had pointed to $59,000-$62,000 as the zone anchored by the 200-week moving average and concentrated buying volume. June 25 broke the lower boundary of that zone, pushing BTC to $58,189 before a partial recovery.
A decisive close below $58,000 over multiple sessions would make the PCE relief look structurally irrelevant, and a convincing breach of $60,000 would set up $50,000 as the next psychological target.
US-traded spot Bitcoin ETFs logged net outflows of $68.3 million on June 22, $113.8 million on June 23, and $469 million on June 24, for a total of roughly $651 million across three sessions.
| Stress point | Data point | Interpretation |
|---|---|---|
| Intraday BTC low | $58,189 | Bitcoin nearly lost the key $58K stress level |
| Partial recovery | ~$59,542 | Relief bounce, but no decisive $60K reclaim |
| Bull support zone | $59K–$62K | Previously viewed as the defense area |
| Break-risk level | Below $58K close | Would imply PCE relief failed to stabilize BTC |
| Next bearish zone | $50K–$54K | Psychological/realized-price downside area |
| ETF outflows, June 22 | -$68.3M | Early flow pressure |
| ETF outflows, June 23 | -$113.8M | Outflows accelerating |
| ETF outflows, June 24 | -$469.0M | Capitulation-style flow day |
| Three-session ETF total | -$651.1M | Confirms pressure beyond macro headline |
| MSTR intraday low | ~$85 | Strategy anxiety remains crypto-specific overhang |
| STRC preferred stock | ~$89 vs. $100 par | Funding-channel pressure |
Strategy amplifies the macro headwind with a crypto-specific funding problem, as MSTR fell to an intraday low near $85 on June 25 before trading around $87, and the company’s STRC preferred stock dropped below its $100 par value to $89, closing one of Strategy’s BTC funding channels.
Blume said Strategy’s behavior has “scared the market,” with its preferred equity near 80 cents on the dollar. He argued the fears are emotional, but STRC is still below par, MSTR is still below $90, and neither resolves on PCE data.
Forced selling exhausts itself
Glassnode’s Accumulation Trend Score by wallet cohort reached 1, its maximum reading, during the previous plunge towards $60,000.
That means large holders have rotated from distribution to active accumulation in the previous correction, with investors purchasing a net 259,298 BTC between $59,000 and $67,000 since June 5.
Over 10.5 million BTC sat at an unrealized loss as of early June, exceeding the amount held in profit for the first time this cycle.
Mena pointed to March 2020 and the FTX collapse in 2022 as the closest historical analogs, both of which saw forced selling exhaust itself before major recoveries.
Blume made the same point from a different angle, arguing that the selling coming out of Strategy-adjacent anxiety is “largely emotional, but not truly a structural issue.”
With half of all holders at an unrealized loss and Glassnode’s score at 1, the accumulation is absorbing forced selling. Mena attributed the recent selling to basis trade unwinds as the CME premium collapsed, driven by the mechanical closing of positions among traders.
The bull sequence requires cooperation from oil and the Fed, as Brent settled at $73.74 on June 24 and WTI at $70.34 after roughly 20 million barrels exited the Strait of Hormuz in 24 hours, pulling the energy component lower.
If that holds into June and July inflation prints, it gives the Fed cover to hold. Köymen’s base case has the Fed holding across the next two to three meetings if Hormuz flows continue to improve.
A Fed hold, softer energy, and cooler-than-expected sequential CPI and PCE readings would pull the dollar lower, creating room for Bitcoin to reclaim $66,000-$67,000. Clearing that level and $70,000-$75,000 enter the conversation, followed by the $82,000-$85,000 ceiling that has capped Bitcoin since February.
The bear case rests on existing forces: September hike odds above 60%, continued ETF outflows, and Strategy’s STRC still below par.
A CEPR analysis of the Iran war shock estimated that even a cautiously optimistic Hormuz disruption scenario could still add 0.6 percentage points to US headline inflation and 0.2 percentage points to core in 2026, putting the Fed’s 2026 projections further above target.
If BTC loses $58,000 on a closing basis with outflows continuing and the dollar reasserting itself, the $50,000–$54,000 band becomes the next zone to watch.
| Scenario | Trigger | BTC level to watch | Macro read | Article takeaway |
|---|---|---|---|---|
| Bull case | Oil relief holds, June/July inflation cools, ETF outflows reverse | Reclaim $66K–$67K | Fed gets room to hold | Forced selling may be exhausted |
| Extension case | BTC clears $67K, then $70K–$75K | $82K–$85K ceiling | Dollar/rates pressure fades | Upside resumes, but still macro-dependent |
| Base case | BTC holds $58K–$60K but fails to reclaim $67K | $59K–$62K | PCE relief stabilizes but does not rescue | Sideways, fragile liquidity trade |
| Bear case | BTC loses $58K on closing basis, ETF outflows persist, dollar firms | $50K–$54K | Fed ceiling overwhelms relief | PCE was not enough |
| Inflation-shock case | Hormuz/oil shock feeds into CPI/PCE | Sub-$50K risk | Fed forced more hawkish | Macro tail risk reopens |
The next Bitcoin price move
Whether oil relief translates into softer June and July inflation data will determine how much room the Fed has to hold and how much room Bitcoin has to reclaim $66,000.
If ETF outflows reverse as macro anxiety fades, the bull case for exhaustion in forced selling becomes self-reinforcing. If outflows persist despite a benign PCE print, the data confirm structural de-risking.
The $59,000-$62,000 zone held by the thinnest margin, and reclaiming $60,000 on a closing basis with improving ETF flows would confirm that the June 25 macro reprieve translated into something durable.
Failing to do so would confirm that ETF outflows and the Fed ceiling will decide the next leg.
The post Bitcoin nearly loses $58K as ETF outflows decide whether inflation relief holds appeared first on CryptoSlate.